

A university’s student retention rate says more about its health than its admissions figures ever could. Enrolment tells you who walked through the door; retention tells you whether the institution is actually keeping them there, progressing, and on track to graduate.
For decades, universities have treated retention as a student affairs concern, something to fix with better orientation weeks or friendlier advisers. That view is changing. Governments, investors, and institutional boards are beginning to read it the way financial analysts read customer churn: as an early signal of whether an organisation is built to last. A campus that fills its lecture theatres in September but empties them by the following year is not a stable institution, no matter how strong its application numbers look, and rising higher education dropout rates in any single cohort should worry a board long before graduation data confirms the loss.
Read More: From Pilot to Scale: How Universities Grow From 50 to 5,000 International Students
What Is the Student Retention Rate?
The student retention rate measures the proportion of students who remain enrolled at the same institution from one term to the next, most commonly from their first year into their second. If 1,000 students start a degree in September and 830 are still registered at that same university a year later, the rate is 83%.
Methodology matters here. Some institutions track fall-to-fall retention, others fall-to-spring, and the National Student Clearinghouse Research Center draws a careful distinction between retention, staying at the same institution, and persistence, staying enrolled anywhere in higher education. A student who transfers counts against retention but not against persistence. Completion and graduation rates are different again: they measure whether a student eventually earns a credential, often tracked over six or eight years. Any institution publishing a retention figure should state its cohort, timeframe, and definition, because an unqualified number invites misreading and makes year-on-year comparison unreliable.
Why the Student Retention Rate Matters More Than Enrolment Alone
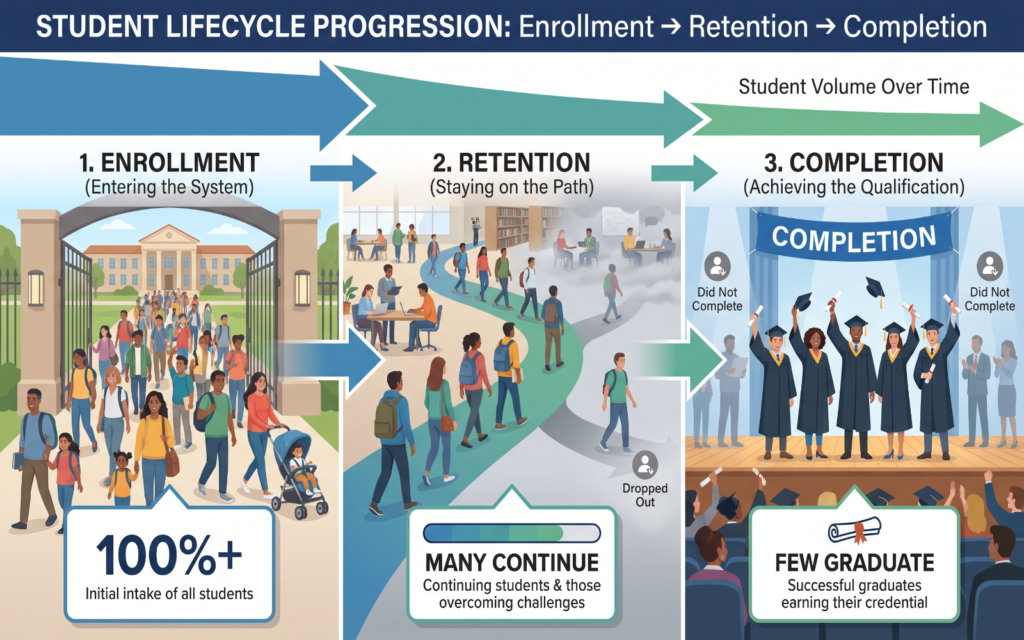
Enrolment measures who enters; retention measures who continues; completion measures who ultimately earns a credential. Strong recruitment paired with a weak retention rate is rarely a marketing problem. It usually points to gaps in academic support, advising, or the day-to-day student experience.
Retention also arrives early. Institutions typically wait years for graduation data, but a first-year retention figure is available within twelve months of enrolment, giving leadership teams a far faster read on whether resourcing, curriculum design, and student services are working as intended. That earlier signal feeds directly into budget planning, staffing decisions, and academic scheduling, which is precisely why it belongs alongside enrolment and completion in any serious set of student success metrics rather than sitting apart from them.
Read More: Optimising Student Data Systems for Universities
What Does the Global Picture Actually Show?
There is no single global retention benchmark, and institutions should be wary of anyone who claims otherwise. Rates vary by country, institution type, student demographic, enrolment intensity, and field of study, so a figure that looks strong in one system may look ordinary in another.
In the United States, the National Student Clearinghouse Research Center’s 2026 Persistence and Retention Report found that 83.2% of fall 2024 starters remained at their original institution into spring 2025, falling to 69.1% a year later. The wider persistence figures, counting students who continued anywhere in higher education rather than at one institution, were higher still: 85.8% and 77.1% respectively, the strongest second-year persistence result in a decade. These figures describe the American system specifically and should not be read as a global average.
Elsewhere, OECD data show that across 32 OECD and partner countries, only 43% of bachelor’s students graduate on time, rising to 70% within three additional years, a reminder that retention and completion rates diverge sharply once timeframes lengthen. Both the UNESCO higher education programme and the World Bank’s tertiary education work note that access and completion gaps remain wide across income levels and regions, particularly outside high-income systems where comparable national data is harder to come by.
What Causes Students to Leave Higher Education?

Dropout is rarely caused by a single factor. Institutions consistently see attrition driven by a combination of:
- Financial pressure, including tuition, living costs, and unexpected shortfalls
- Academic difficulty and poor programme-course fit
- Weak advising, mentorship, and early academic support
- Work and family responsibilities competing with study time
- Mental health and wellbeing challenges
- A weak sense of belonging or community
- Administrative friction, from registration to financial aid processing
- Limited flexibility for part-time or working students
- Connectivity or technology access barriers
This list matters strategically because it points to elevated higher education dropout rates being a systems problem rather than a motivation problem. Fixing it requires coordinated action across finance, academics, and student services rather than a single intervention aimed at one cause.
Read More: Digital Transformation Strategy for Universities: A Guide for Higher Education Leaders
The Financial Case for Improving Retention
Every student who leaves represents lost tuition revenue, a seat that must be refilled through costlier recruitment, and a disruption to enrolment forecasting. Attrition also weakens the pipeline into completion, since students who leave early rarely return to finish what they started. None of this means every retained student carries identical financial value; the effect depends on tuition structure, funding model, and programme cost, and institutions should resist presenting a flat figure per retained student as if it applied everywhere. But the direction is consistent: institutions that stabilise their student retention rate build steadier revenue, more predictable staffing needs, and stronger long-term financial planning, all of which matter to boards and funders assessing institutional performance indicators over time.
Which Student Success Metrics Should Universities Track?

Retention should never be read in isolation. A useful framework tracks it alongside:
- Persistence, continued enrolment across any institution
- Completion and graduation rates, credential attainment within a defined period
- Course completion and time to completion, indicators of academic progression
- Student engagement and satisfaction, measures of experience
- Transfer rate, movement between institutions
Read together, these retention and completion rates give university leaders a far more honest picture of institutional performance than any single figure can, and they make it harder for a strong headline number to mask weaker underlying trends.
Technology’s Role in Supporting Retention
Digital student-support infrastructure will not fix a broken advising model, but it materially improves how early problems are caught. Learning analytics and early-warning systems flag disengagement before it becomes withdrawal, often weeks before a struggling student would otherwise reach out. Automated, personalised communication keeps students informed about deadlines, financial aid, and available support without relying on them to seek it out. Flexible, low-bandwidth access matters in regions where connectivity is inconsistent, extending support to students who cannot reliably attend in person or stream heavy content.
Technology’s role is to strengthen academic, financial, and pastoral support, not to substitute for it, and institutions that treat it as a replacement for human advising tend to see limited gains in retention.
Why Retention Data Needs to Be Granular
An institution-wide retention rate can conceal serious disparities. Breaking figures down by programme, campus, entry pathway, enrolment mode, and socioeconomic background often reveals that headline numbers mask underperformance in specific student segments. A university reporting a healthy overall rate may still be losing a disproportionate share of first-generation or part-time students, a gap that only becomes visible once the data is disaggregated rather than reported as a single average.
Read More: The International Enrolment Metrics Every University Leadership Team Should Track
From Retention KPI to Institutional Investment Metric

This is where the strategic shift matters most. Retention should inform budget planning, student-success investment, programme evaluation, and digital transformation decisions, not sit in a student affairs dashboard disconnected from institutional strategy. For governments funding public universities and investors backing private ones, retention functions as one of several institutional performance indicators alongside financial sustainability and completion outcomes, because it shows whether an institution can convert enrolment into sustained student progress rather than short-term intake. Read this way, retention stops being a support-team metric and becomes a genuine strategic and investment signal.
The student retention rate is no longer a peripheral academic-support statistic. It is an early, honest signal of institutional health, one that connects directly to financial sustainability, student outcomes, and long-term reputation. Universities that treat it as a strategic investment metric, tracked alongside enrolment, completion, and student engagement, are better placed to plan resources, satisfy funders, and support students through to graduation.
Student Retention FAQs
- What is the student retention rate? It is the percentage of students who remain enrolled at the same institution from one academic period to the next, most often measured year over year.
- How is student retention calculated? Divide the number of returning students from a cohort by the total number who started, then multiply by 100. A cohort of 1,000 with 830 returning gives an 83% rate.
- What counts as a good retention rate? It depends entirely on institution type, country, and student population, so any benchmark should be compared against similar institutions rather than treated as a universal target.
- How is retention different from completion? Retention measures continued enrolment year to year; completion measures whether a student eventually earns a credential, often tracked over six or eight years.
- Why do students drop out of university? Financial strain, academic difficulty, weak support systems, and personal or family responsibilities are the most common drivers, usually in combination rather than isolation.
- How can universities improve retention? Through earlier academic support, better advising, financial aid clarity, and digital tools that flag disengagement before it becomes withdrawal.
Higher education performance is about more than attracting students. Explore how stronger digital infrastructure and student-success systems can help institutions turn enrolment into sustained progression and completion, or get in touch to talk through what that could look like for your institution. For more on how we approach education infrastructure, visit our blog.